Pressure modulation
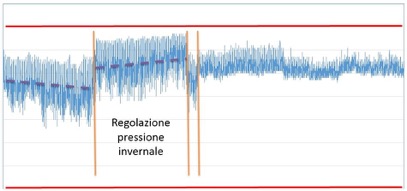
Pressure trend during the year shows that with decreasing temperatures (dashed line), pressure drops because of the increased gas consumption. Gas Distribution Company increases the outlet pressure of the pressure reducing stations in order to keep a high level of network service. Subsequently, with increasing temperature (dashed line) the pressure rises again, caused by gas consumption reduction. Again, pressure reducing stations calibration values are reduced. The chart shows a sudden pressure drop referred to a few days interval, maybe due to an unexpected temperature drop: the manual regulation of the calibration pressure does not respond to sudden load variations.
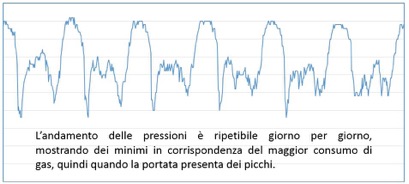
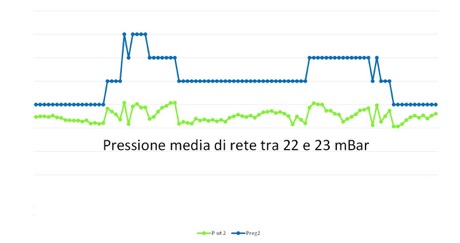
The chart below shows a pressure minimum around 06:00am, at 06:00 pm and some days at 12:00 am: at these times there is a greater gas consumption that tends to “relieve” the network.
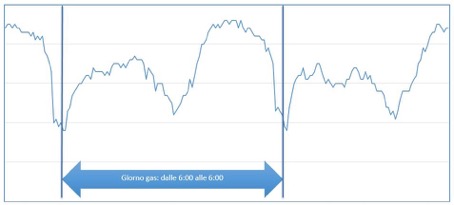
Looking at the pressure trend during the day, it is possible to see that a fixed regulation of the output pressures from the reducing stations matches a variable user pressure, as big as the gas consumption. This pattern is characteristic of each network, depending on its morphology (diameters and widths), the number of users, etc. Changing the output pressure of the reducing stations (i.e. by time slots), user’s pressure variation decreases, and so does the average network pressure. .
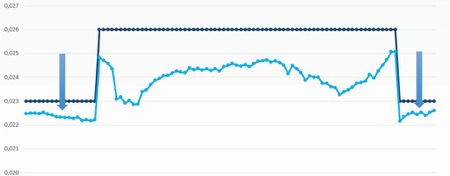
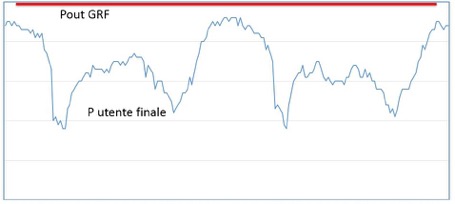
The chart displays how is possible to obtain a user pressure reduction lowering the output pressure coming from the pressure reducing station during lower gas consumption hours (22:00-4:00) from 26 mbar to 23 mbar.
It is possible to get a faster and more flexible adjustment of the load variation with a bigger reduction of the users pressures variation thanks to a pressure regulation based on the actual consumption flow.
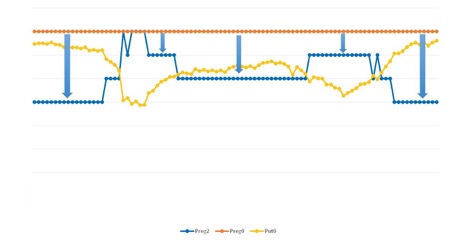
The output pressure at the pressure reducing stations changes depending on the gas consumption in the first place, and then depending on the flow. When the flow rate decreases, the pressure decreases accordingly. .
In this way the pressure shows a trend constrained in a narrow section.
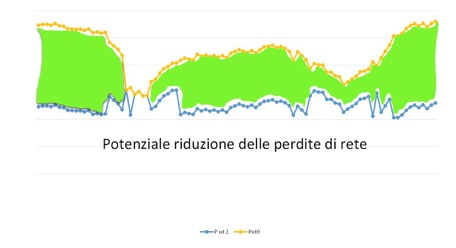
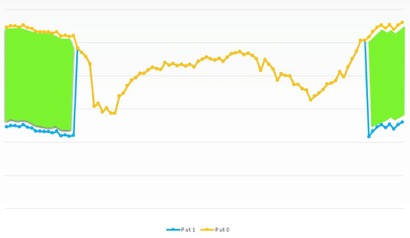
The green area represents the network’s pressures reduction that can be obtained optimizing output pressure coming from pressure reducing stations: this area gives a qualitative measure of the network leakages reduction.